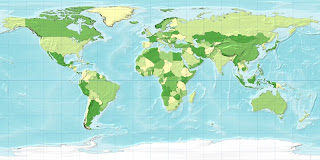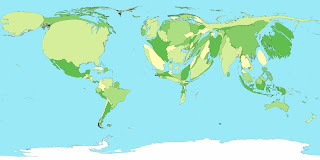

Another variable is used to graph area. The size of each area represents the size of the variable that is being maped; it is distorted to match the value of the variable. I found this one to be quite interesting .. Energy consumption!! What a hot topic today with our current gas prices. The map on the left is a normal world map which the cartogram on the right represents energy consumption. The USA looks kind of puffy and swollen!!
Downloaded from: http://www-personal.umich.edu/~mejn/cartograms/
No comments:
Post a Comment