Sunday, July 27, 2008

Cartogram-Energy Consumption


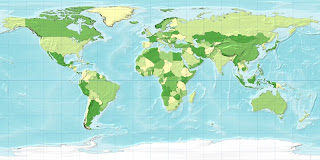
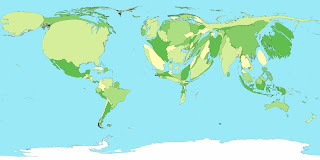
Another variable is used to graph area. The size of each area represents the size of the variable that is being maped; it is distorted to match the value of the variable. I found this one to be quite interesting .. Energy consumption!! What a hot topic today with our current gas prices. The map on the left is a normal world map which the cartogram on the right represents energy consumption. The USA looks kind of puffy and swollen!!


Isolines/Bathymetric Map


Isoline maps depict geographic areas with lines of equal value. A bathymetric map depicts elevation of surfaces below water. Lines of equal value represent the elevation. Downloaded from:

Sunday, July 20, 2008

Star Plots


A star plot compares multiple variables for each observation. The center point or radii is the actual observation point. This matrix compares different vehicles based on price, milease, head room, trunk space, etc. Data and download available at:

Correlation matrix


A correlation matrix is done to see where there is a correlation among the data. In this matrix, investor funds are correlated to regions, styles of investment, secort, bonds, and the foreign exhange.
Downloaded from:

Similarity matrix


A similarity matrix is used to show how similar (or not) the variables are to one another. This matrix shows the similarity of molecules.
Downloaded from:
http://images.google.com/imgres?imgurl=http://www.biosolveit.de/HTSview/images/matview.jpg&imgrefurl=http://www.biosolveit.de/HTSview/screenShots/matview.html&h=622&w=808&sz=745&hl=en&start=18&um=1&tbnid=1avTxXr2212mxM:&tbnh=110&tbnw=143&prev=/images%3Fq%3Dsimilarity%2Bmatrix%26um%3D1%26hl%3Den%26rlz%3D1T4GGIK_enUS281US281%26sa%3DN

Stem and Leaf Plot

A stem and leaf plot uses the higher number as the stem and the secondary numbers as the leaf. These plots show the frequency of values. This plot show infant mortality rates in Western Africa.

Downloaded from: http://images.google.com/imgres?imgurl=http://mainland.cctt.org/mathsummer/JosephBond/StemAndPlots/images/table2.gif&imgrefurl=http://mainland.cctt.org/mathsummer/JosephBond/StemAndPlots/stem-and-leaf_std.htm&h=395&w=291&sz=6&hl=en&start=1&um=1&tbnid=BsYfupzY6aptDM:&tbnh=124&tbnw=91&prev=/images%3Fq%3Dstem%2Band%2Bleaf%2Bplot%26um%3D1%26hl%3Den%26rlz%3D1T4GGIK_enUS281US281%26sa%3DN

Box Plot


A box plot which is also known as box and Whisker Plot, is a summary of a set of data, in this case, scores from site samples of a creek.